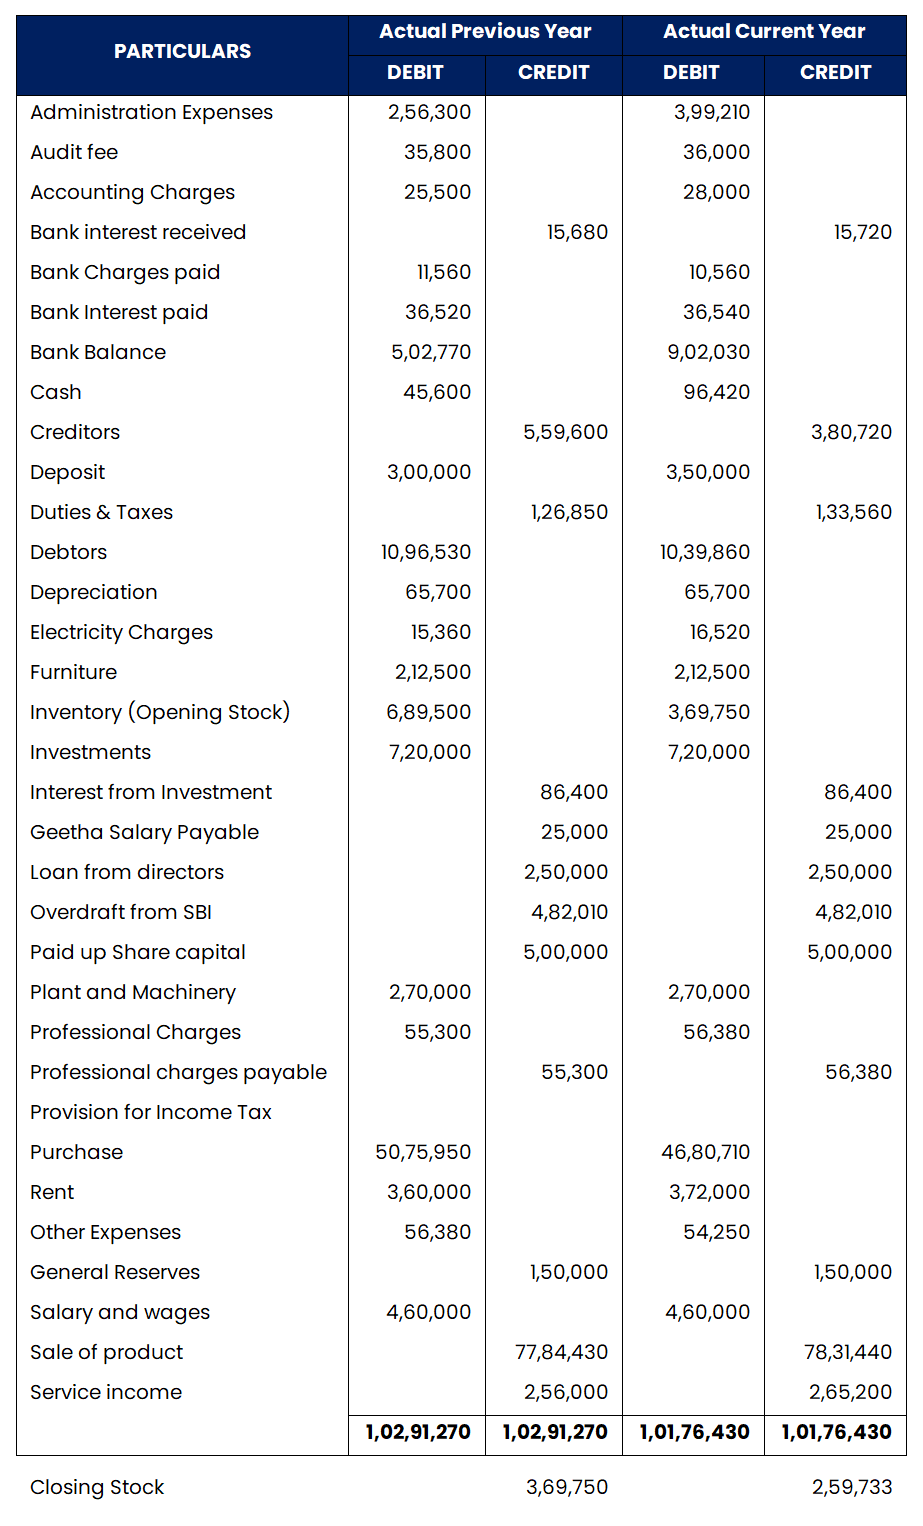
Trial Balance of Finc Power Sources Private Limited
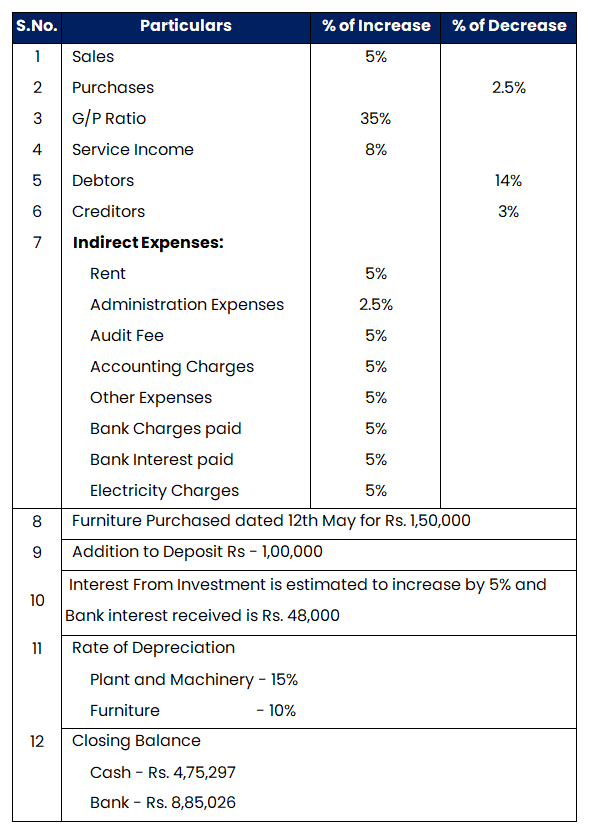
Estimate as at end of current year
Solution:
Budgeted Trial Balance

Notes for Budegeted Trail Balance:

Balance Sheet

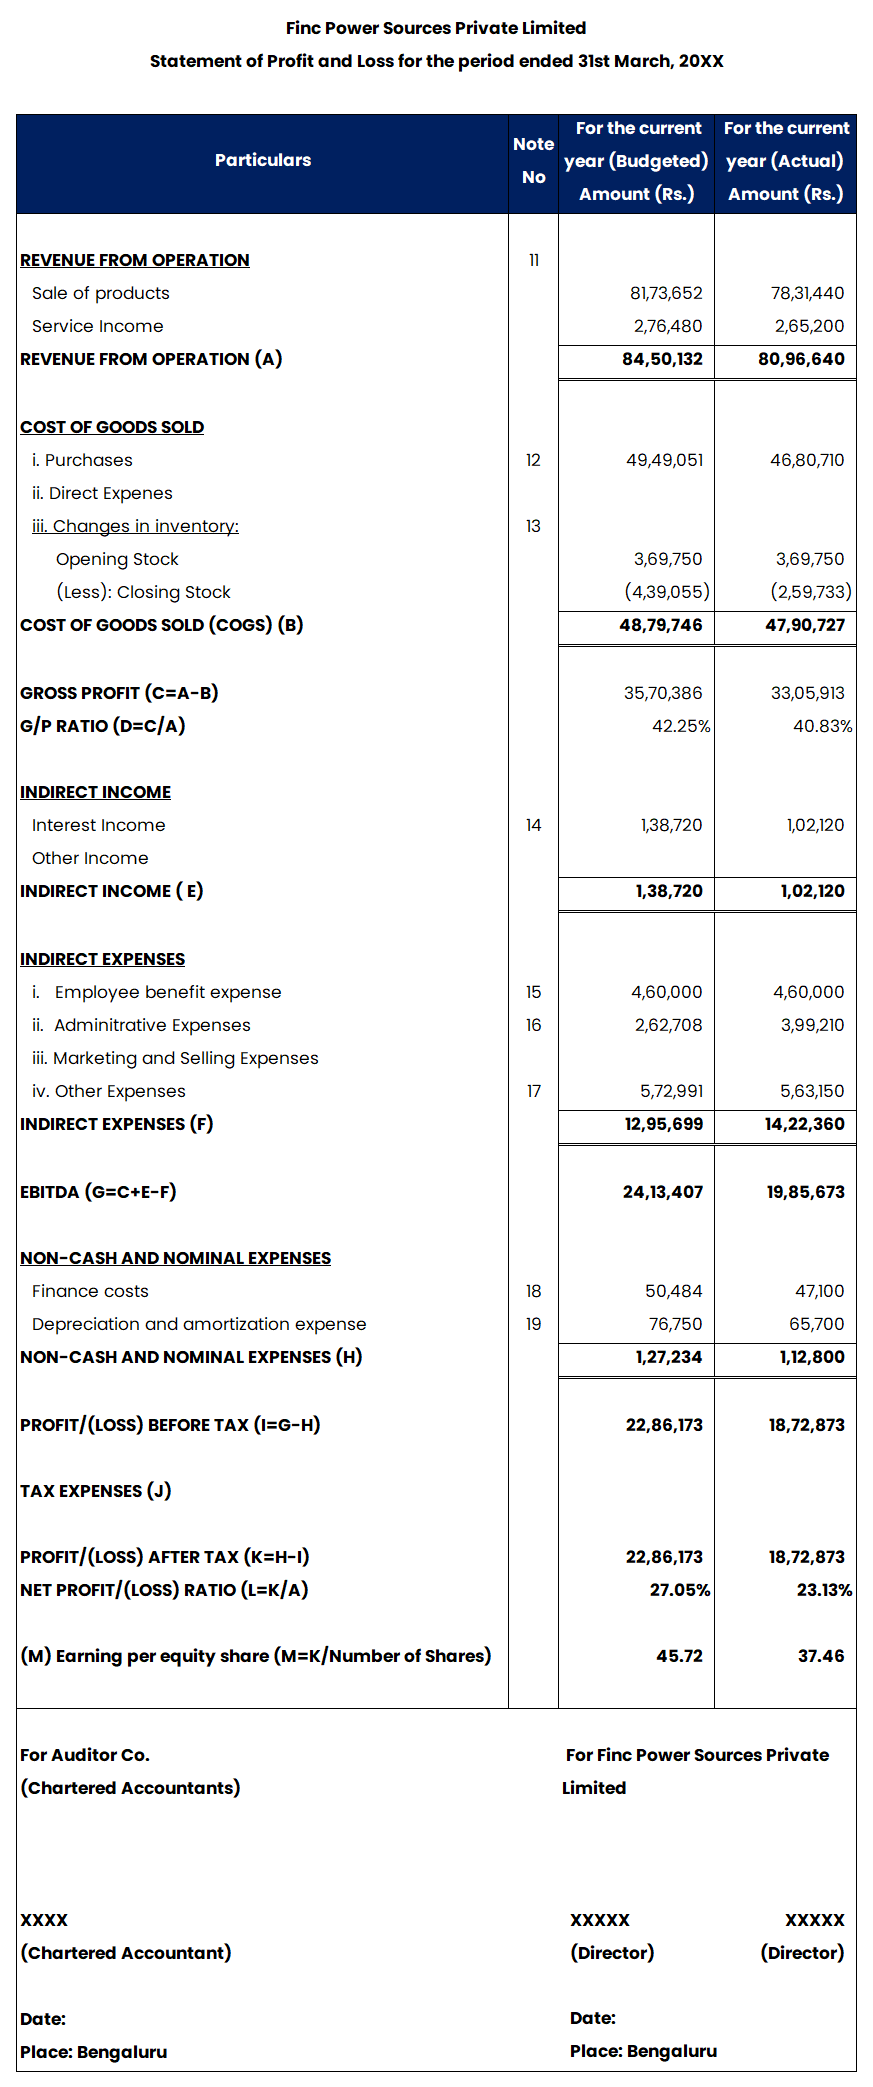
Statement of Profit and Loss
Notes to Accounts (Balance Sheet):

Notes to Accounts (Profit & Loss):

MIS Analytical Tools


GP Ratio
Gross profit margin depends on the relationship between sales price, volume and costs. A high Gross Profit Margin is a favourable sign of good management.
Net Profit Ratio
Net Profit ratio finds the proportion of revenue that finds its way into profits after meeting all expenses. A high net profit ratio indicates positive returns from the business.
Receivable Turnover Ratio
In case firm sells goods on credit, the realization of sales revenue is delayed and the receivables are created. The cash is realised from these receivables later on. The speed with which these receivables are collected affects the liquidity position of the firm. The debtor’s turnover ratio throws light on the collection and credit policies of the firm. It measures the efficiency with which management is managing its accounts receivables.
Interpretation:
The average collection period measures the average number of days it takes to collect an account receivable. This ratio is also referred to as the number of days of receivable and the number of day’s sales in receivables. In determining the credit policy, debtor’s turnover and average collection period provide a unique guidance.
Inventory Turnover Ratio
This ratio also known as stock turnover ratio establishes the relationship between the cost of goods sold during the year and average inventory held during the year. It measures the efficiency with which a firm utilizes or manages its inventory.
Interpretation:
This ratio indicates that how fast inventory is used or sold. A high ratio is good from the view point of liquidity and vice versa. A low ratio would indicate that inventory is not used/ sold/ lost and stays in a shelf or in the warehouse for a long time.
Debt to Equity Ratio
A high debt to equity ratio here means less protection for creditors, a low ratio, on the other hand, indicates a wider safety cushion (i.e., creditors feel the owner’s funds can help absorb possible losses of income and capital). This ratio indicates the proportion of debt fund in relation to equity. This ratio is very often used for making capital structure decisions such as issue of shares and/ or debentures. Lenders are also very keen to know this ratio since it shows relative weights of debt and equity. Debt equity ratio is the indicator of firm’s financial leverage.
Current Ratio:
“Does your business have enough current assets to meet the payment schedule of its current debts with a margin of safety for possible losses in current assets?” In other words, current ratio measures whether a firm has enough resources to meet its current obligations.
Interpretation:
A generally acceptable current ratio is 2:1. But whether or not a specific ratio is satisfactory depends on the nature of the business and the characteristics of its current assets and liabilities.
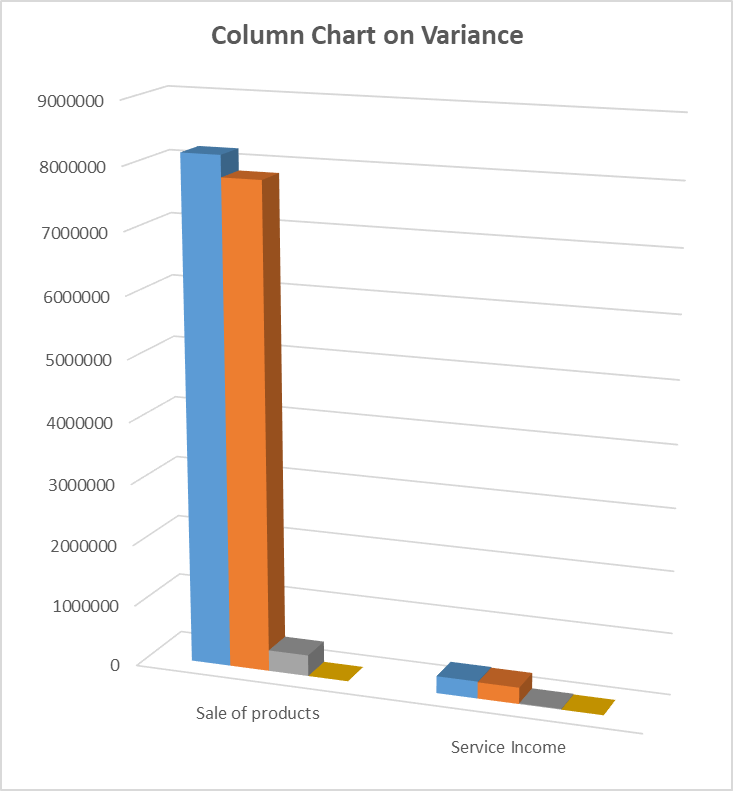
Variance Analysis
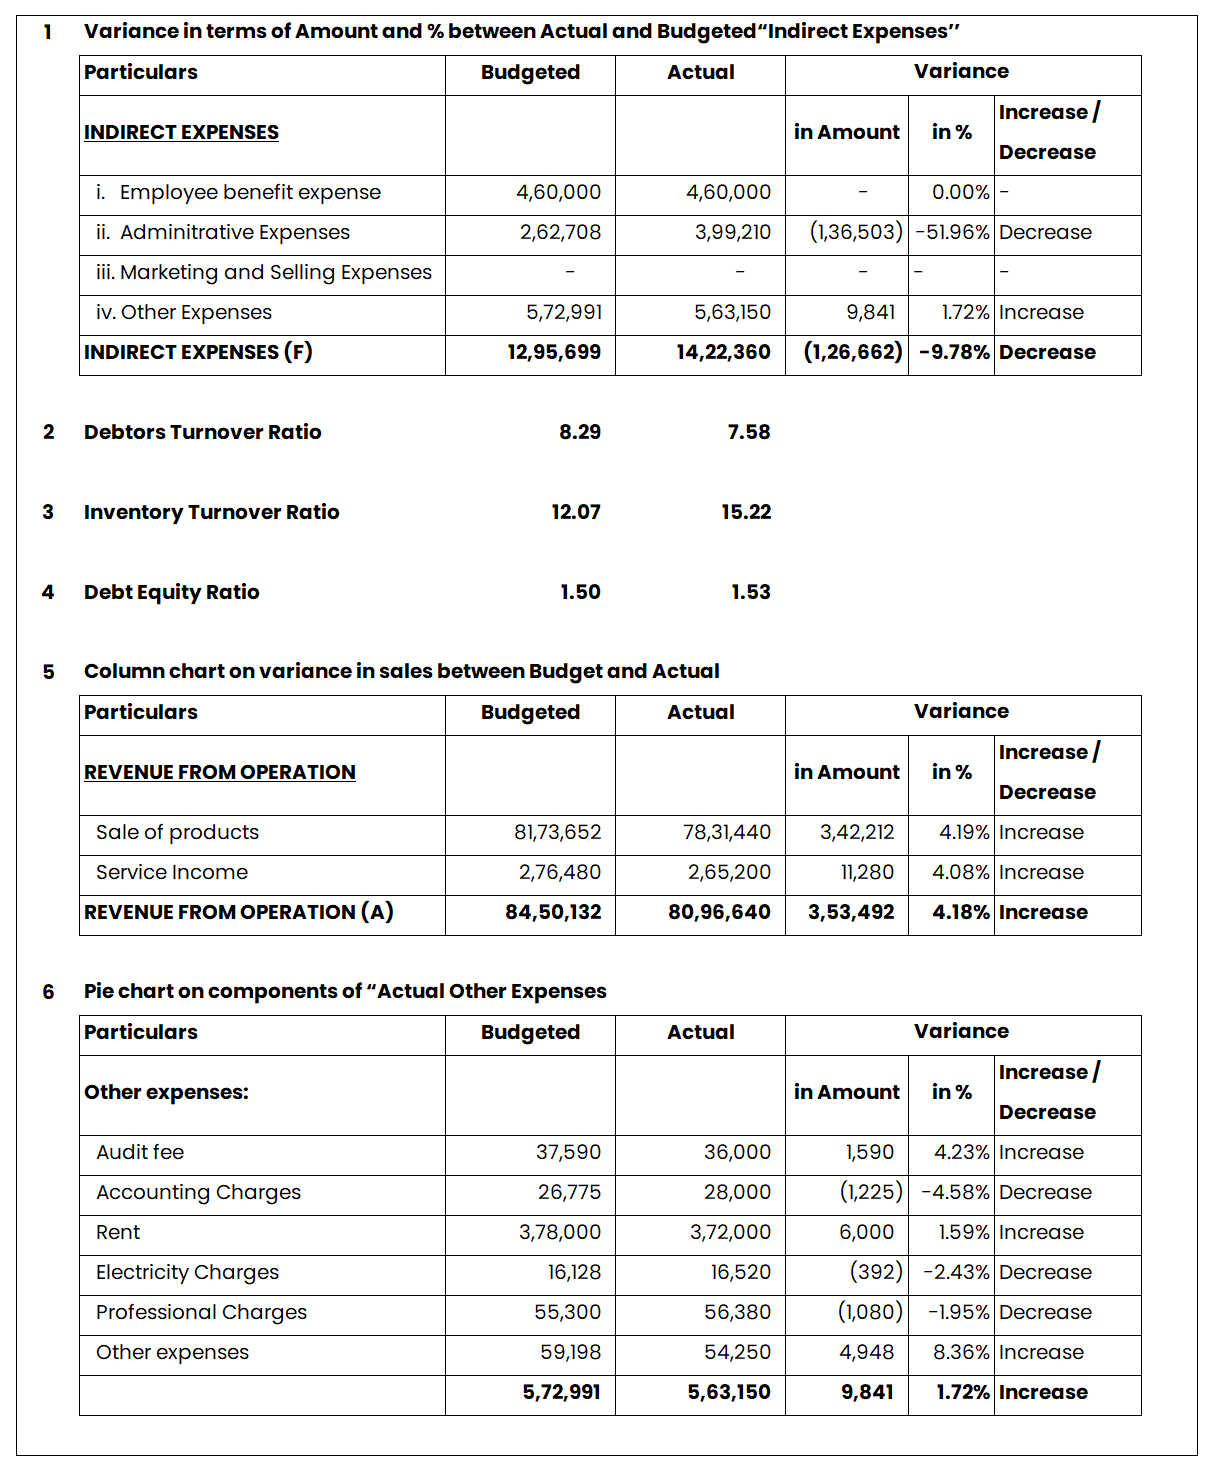
Column Chart
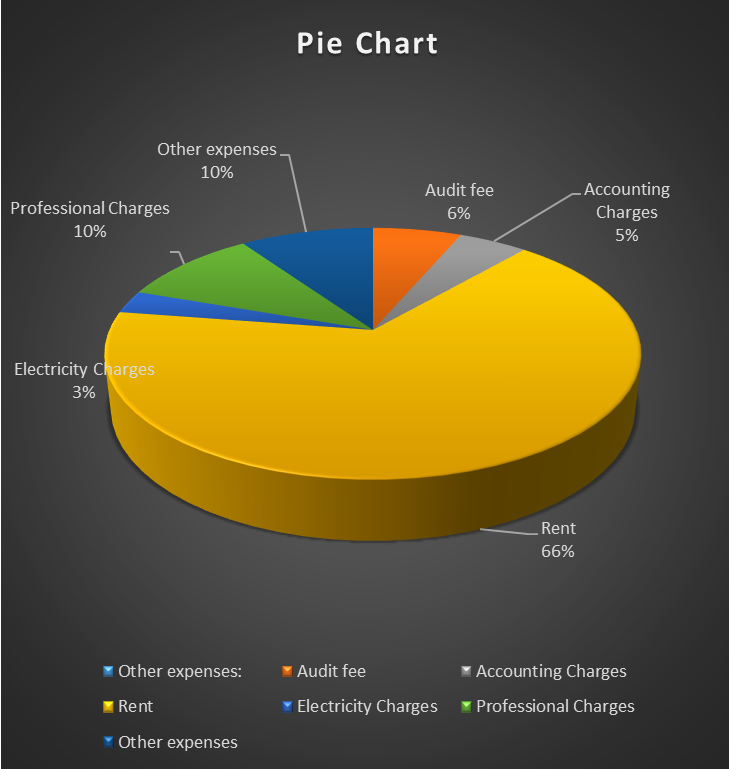
Pie Chart